
Dear Community,
I am currently working on creating a dashboard where I can select municipalities to see their graphical evolution.
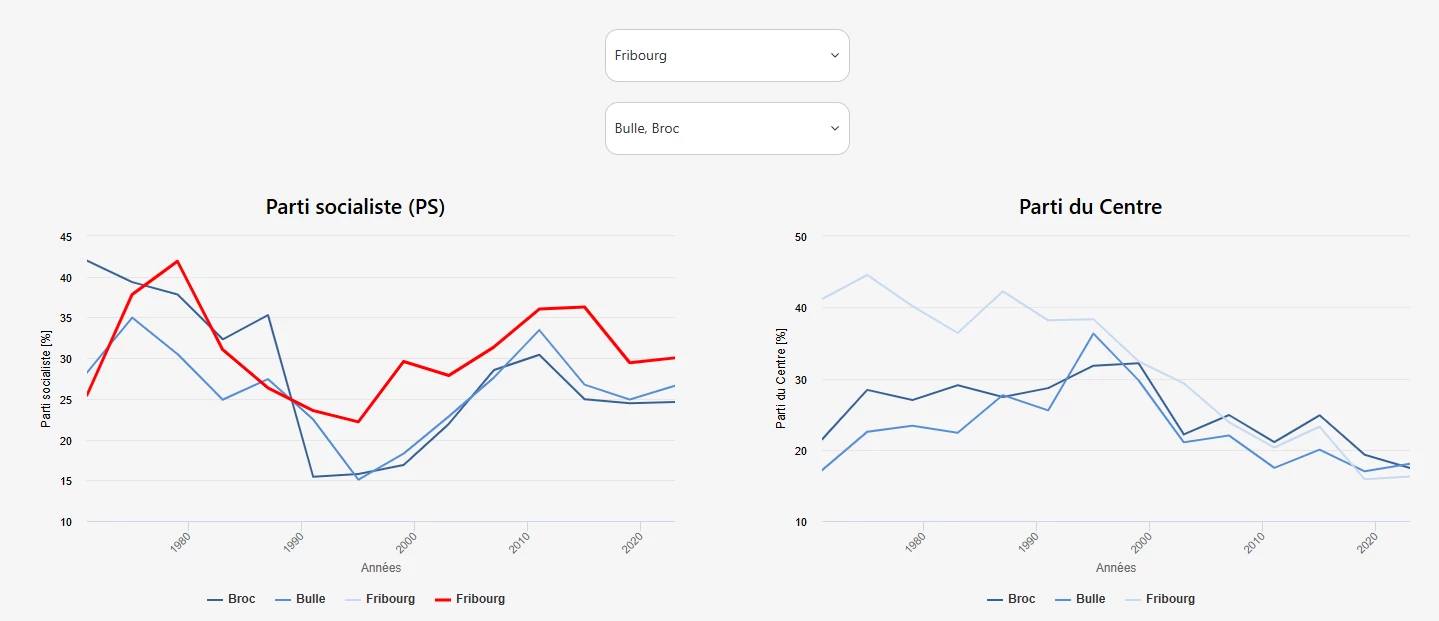
The idea is to have a reference municipality (filter 1 on top) and another filter to select municipalities for comparison (filter 2). I would like the reference municipality to appear in red, for example, and larger than the other municipalities.
I am at an impasse where I have two options (see graphic and code below) :
- The first case (left - Parti socialiste) is graphically convincing, but it is necessary to create two contexts to customize the reference municipality and leave the other municipalities in range-custom. Therefore, the reference municipality appears two times under the graphic in the legend.
- The second case (right - Parti du Centre) adds the selected municipality and the other comparison municipalities to the chart by using the same context. But the problem is that I haven't found a way to customize the first choice (in red) and then display the rest of municipalities in range-custom.
If you have any ideas on how to do merge both cases into the best option, I would be very grateful!
Please don't hesitate to contact me for more details.
Best regards,
Eric
Here is the code for the selectors :
<div class="row">
<div class="filters-container">
<!-- Dropdown communes starts here -->
<div class="ods-select">
<!-- Sélection d'une commune de référence à partir d'une liste -->
<ods-select
selected-values="selected.communeref"
label-modifier="Commune"
placeholder="Commune de référence"
options="values.commune"
multiple="false"
>
</ods-select>
{{partipsref.parameters['refine.commune'] =
particentreref.parameters['refine.commune'] =
partiplrref.parameters['refine.commune'] =
partiudcref.parameters['refine.commune'] =
partivertsref.parameters['refine.commune'] =
partipvlref.parameters['refine.commune'] =
(selected.communeref | toObject:'Commune' | keys);
""}}
</div>
<div class="ods-select">
<!-- Sélection d'une commune à partir d'une liste déroulante -->
<ods-select
selected-values="selected.commune"
label-modifier="Commune"
placeholder="Commune(s) de comparaison"
options="values.commune"
multiple="true"
>
</ods-select>
{{partips.parameters['refine.commune'] =
particentre.parameters['refine.commune'] =
partiplr.parameters['refine.commune'] =
partiudc.parameters['refine.commune'] =
partiverts.parameters['refine.commune'] =
partipvl.parameters['refine.commune'] =
(selected.commune | toObject:'Commune' | keys);
""}}
</div>
{{
partips.parameters['refine.commune'] =
particentre.parameters['refine.commune'] =
partiplr.parameters['refine.commune'] =
partiudc.parameters['refine.commune'] =
partiverts.parameters['refine.commune'] =
partipvl.parameters['refine.commune'] =
(selected.communeref | toObject:'Commune' | keys)
.concat(selected.commune | toObject:'Commune' | keys);
""
}}
</div>
</div>
Here you find the example for both charts :
<div class="row">
<!-- Parti socialiste -->
<div class="col-md-6">
<div class="graph-card">
<h3>Parti socialiste (PS)</h3>
<ods-chart
display-legend="true"
label-x="Années"
single-y-axis="true"
single-y-axis-label="Parti socialiste [%]"
scientific-display="false"
align-month="true"
class="no-bg"
>
<!-- Communes normales (range-custom) -->
<ods-chart-query
context="partips"
field-x="annee"
maxpoints="349"
timescale="year"
series-breakdown="commune"
>
<ods-chart-serie
expression-y="force_des_partis_en_percent"
chart-type="line"
function-y="CONSTANT"
color="range-custom"
scientific-display="true"
>
</ods-chart-serie>
</ods-chart-query>
<!-- Commune de référence (rouge) -->
<ods-chart-query
context="partipsref"
field-x="annee"
maxpoints="14"
timescale="year"
series-breakdown="commune"
>
<ods-chart-serie
expression-y="force_des_partis_en_percent"
chart-type="line"
function-y="CONSTANT"
color="#FF0000"
scientific-display="true"
display-values="false"
>
</ods-chart-serie>
</ods-chart-query>
</ods-chart>
</div>
</div>
<!-- Parti du Centre -->
<div class="col-md-6">
<div class="graph-card">
<h3>Parti du Centre</h3>
<ods-chart
display-legend="true"
label-x="Années"
single-y-axis="true"
single-y-axis-label="Parti du Centre [%]"
scientific-display="false"
align-month="true"
class="no-bg"
>
<ods-chart-query
context="particentre"
field-x="annee"
maxpoints="350"
timescale="year"
series-breakdown="commune"
>
<ods-chart-serie
expression-y="force_des_partis_en_percent"
chart-type="line"
function-y="CONSTANT"
color="range-custom"
scientific-display="true"
>
</ods-chart-serie>
</ods-chart-query>
</ods-chart>
</div>
</div>
</div>