Solved

Displaying Missing Years on Chart

  • April 3, 2025
  • 1 reply
  • 31 views

boris.djakovic
Forum|alt.badge.img

Dear Support Team,

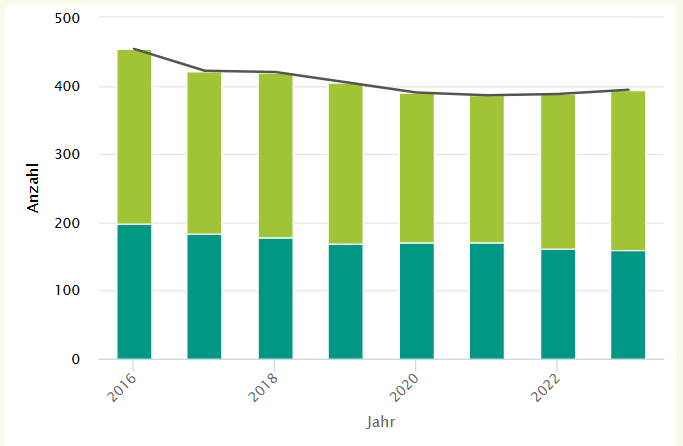
I am currently trying to display data in a chart, and I have encountered an issue. The chart is displaying the years along the X-axis, but some years are not being shown, likely due to space constraints.

Is there a way to force the diagram to display the missing years, such as 2017, 2019, and so on?

Thank you for your assistance. I look forward to your guidance on how to resolve this issue.

Best regards,

Boris

Best answer by Rémy

Hello Boris,

Unfortunately, it's not possible to force the labels of all the years to be displayed on the X axis.
The display module does its best to keep the display as airy as possible, depending on the space available.

1 reply

Rémy
Community Manager
Forum|alt.badge.img
  • Community Manager
  • 24 replies
  • Answer
  • April 16, 2025

Hello Boris,

Unfortunately, it's not possible to force the labels of all the years to be displayed on the X axis.
The display module does its best to keep the display as airy as possible, depending on the space available.