


What if your users could go beyond the predefined table view to explore your data? Discover the new features designed to help them get more value from it (features are only available with the new experience)
A flexible table view to focus on what matters
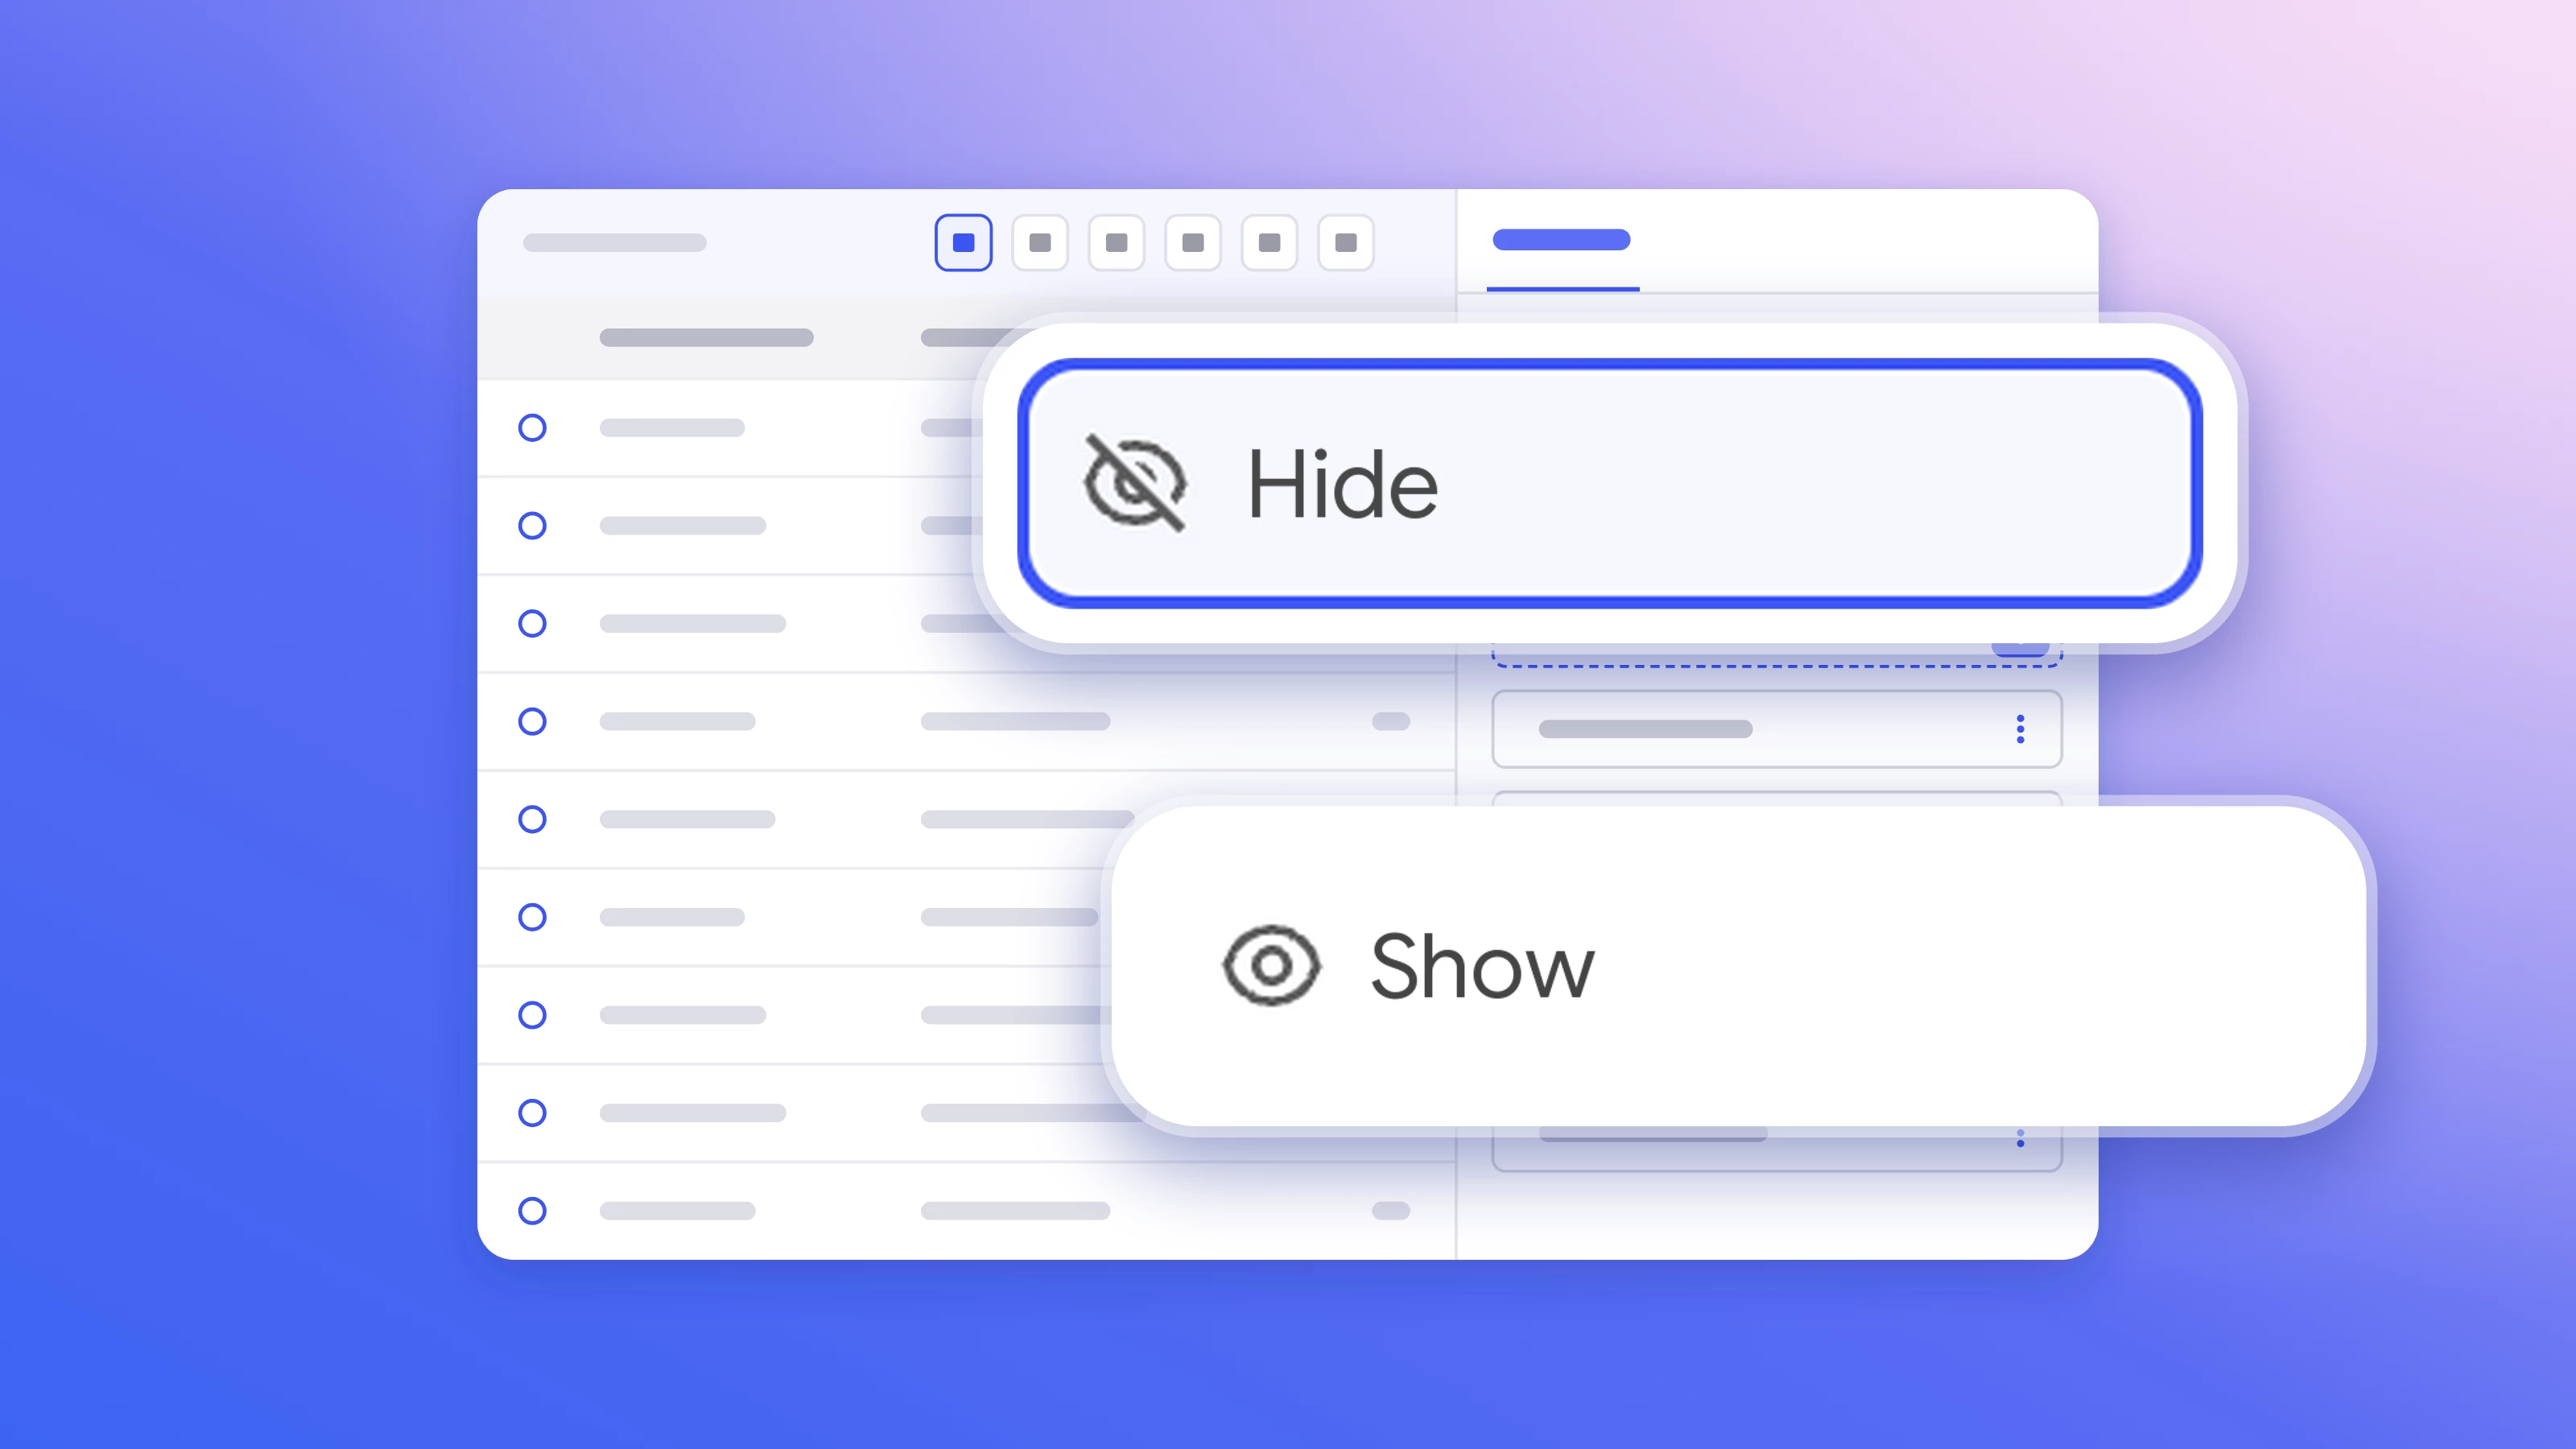
Let your users tailor how your datasets are displayed by showing or hiding the columns of their choice.
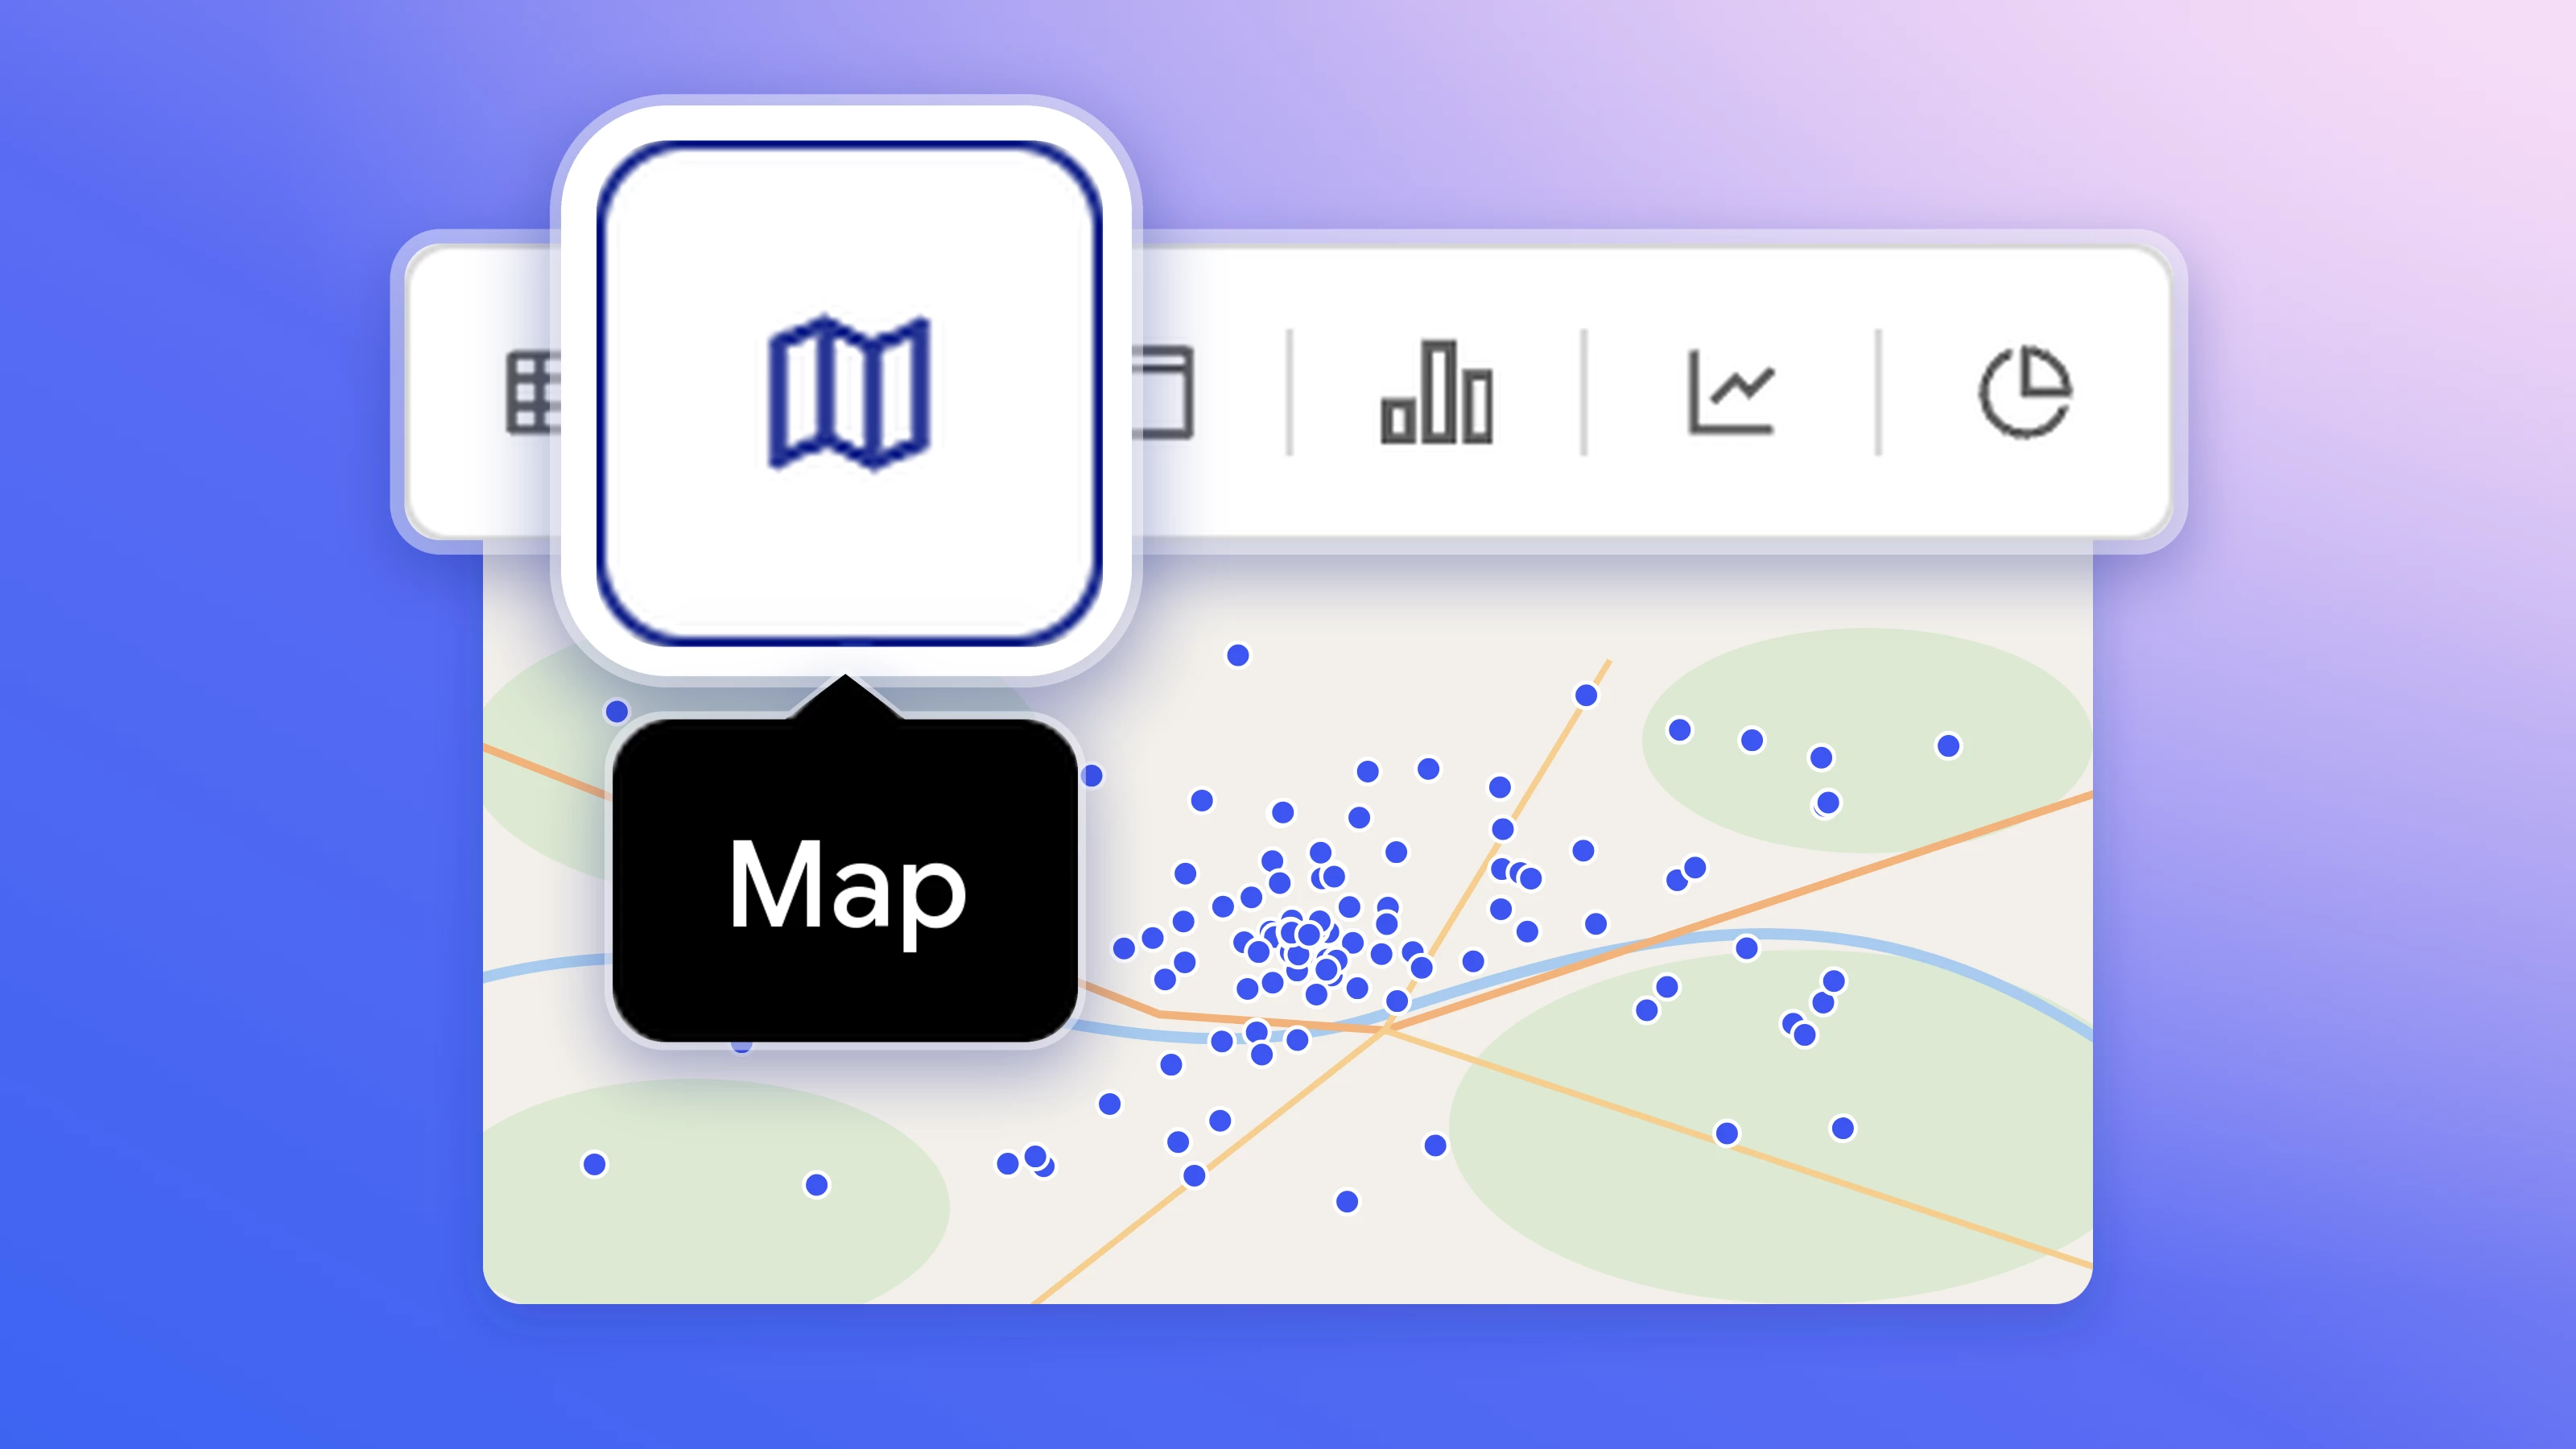
A new dedicated view to explore your geographic data
Give your users a new way to visualize your geographic data with a dedicated, configurable view: they choose which fields to display and how to represent them. It complements the formats already available and lets them switch easily from one to another (chart, pie chart) to explore their data as they need.
A table view aligned with every use of your data
The default table view can no longer be configured. It now follows your datasets' schema automatically, which is the source of truth. What your users see on screen matches exactly the data they get when they use it, including in exports and API queries.
👉 To keep offering a simplified view of your datasets, you can:
- Adjust the view from the schema by reordering or removing fields.
- Set a default sort so the most relevant view of the dataset shows first.
- Create custom views in different formats (chart, map, KPI…).
- Configure the "Security" tab to choose which fields each user or group can see.