
Hey Community,
Just stating the obvious: a data portal without users is useless. The whole point is to make data accessible and used by your target audience.
So, you've launched your portal and kicked off a communication campaign — great. But how do you know if it's working? It all comes down to the usage of your data assets. If they're being consumed, your portal is doing its job.
But how do you measure that consumption? How do you prove the return on investment?
Remember our post on the asset conversion funnel? It’s the path from discovery → evaluation → consumption. In the Asset manager → Analytics tab, you can access insights about this path.
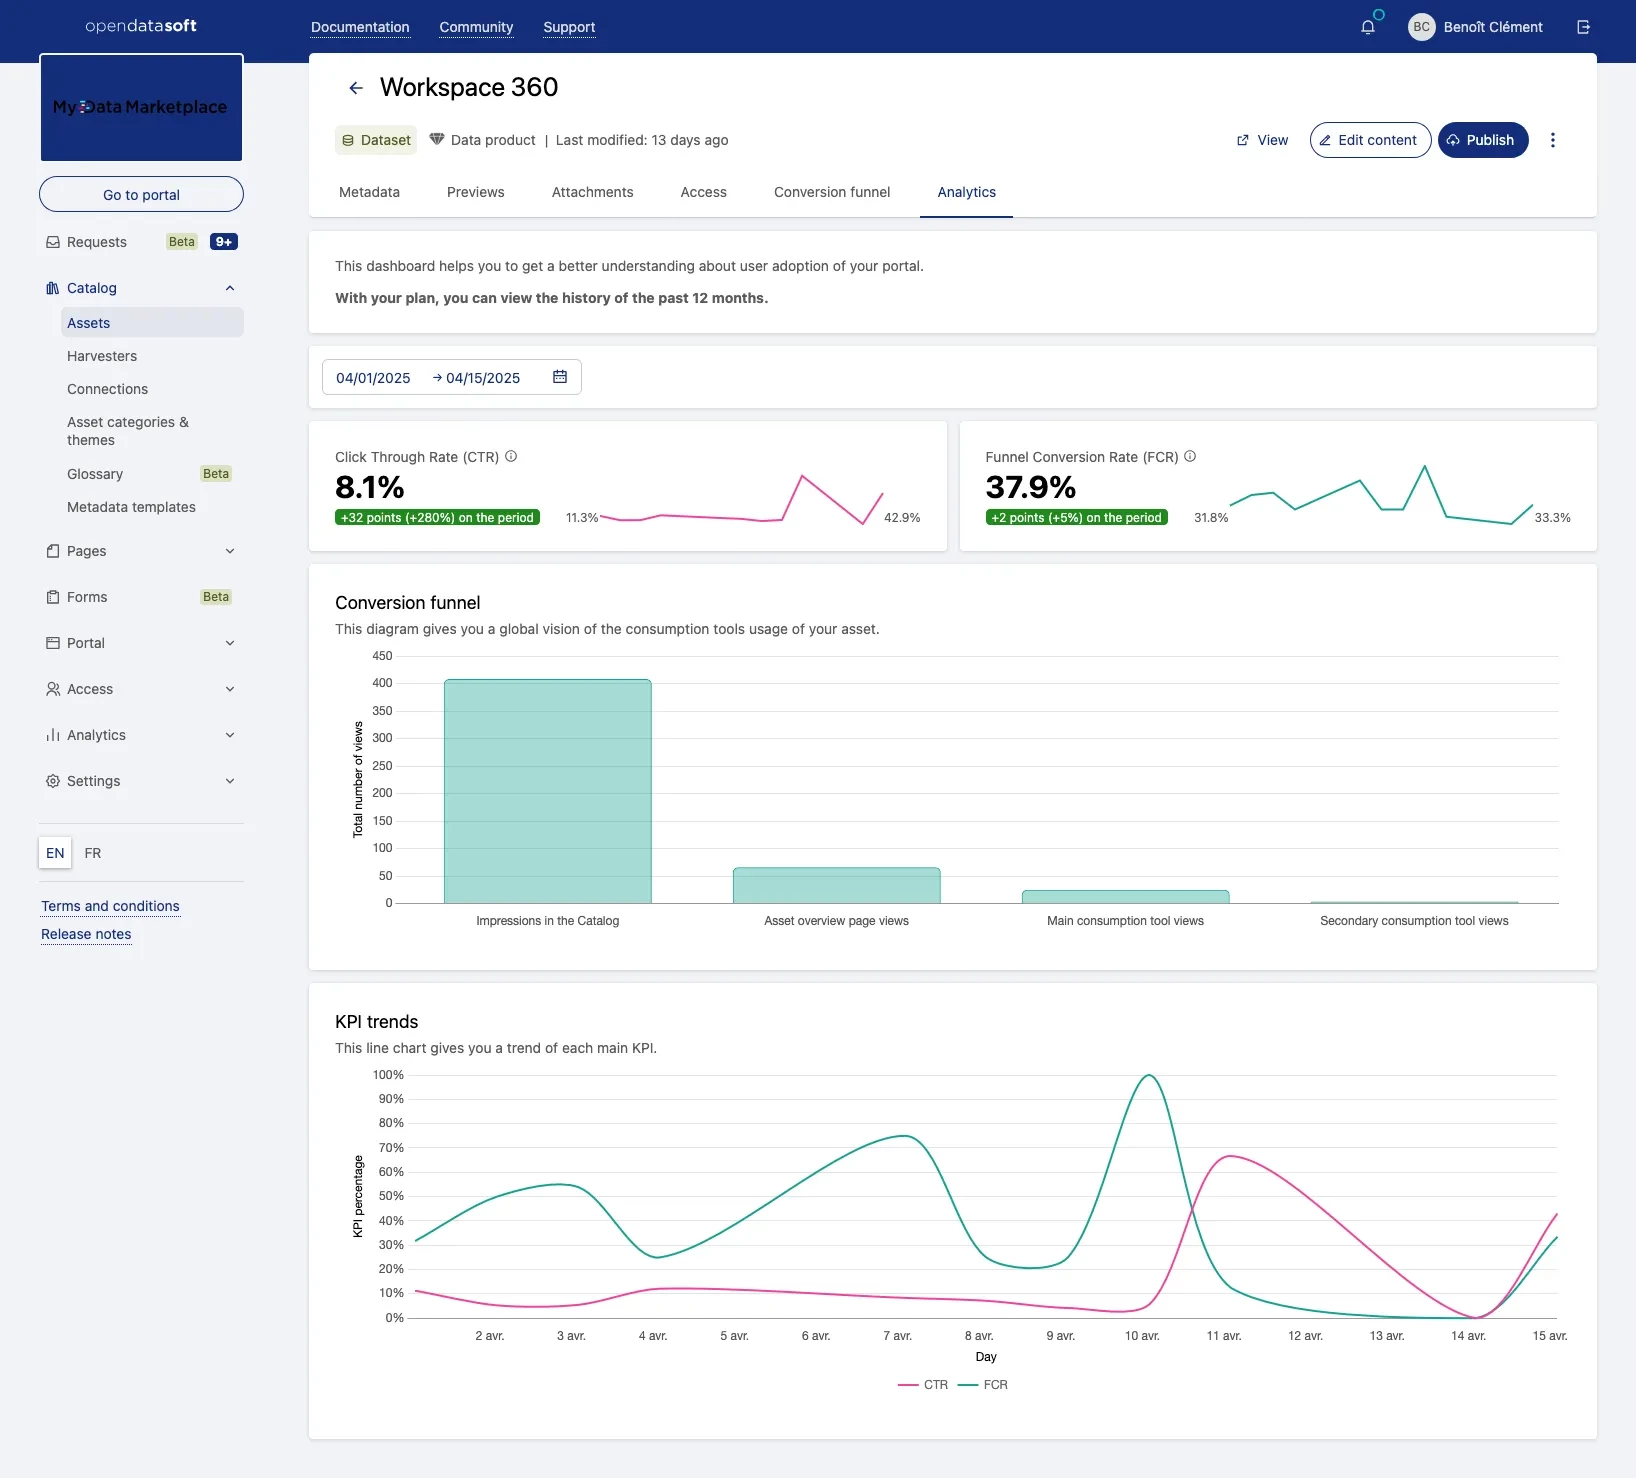
Let’s see what to look at.
Click Through Rate (CTR)
This metric represents how many users saw the asset in search results, and clicked to get to the asset's overview page.
CTR = (Number of clicks on an asset card in the searches) * 100 / (Number of impressions of an asset in the searches)
🤔 What’s a “good” CTR?
- It always depends on the context — but don’t aim for 100% 😉
- Just to give you an idea:
- Google Search Ads: 3–5% (average)
- Email campaigns: 2–5%
- B2B LinkedIn Ads: 0.4–1%
- The real game? Track your CTR over time 📈 (see KPI trends). A growing curve = growing interest.
- Also, compare your assets: which ones drive the most clicks?
- Look for patterns: what makes high-CTR assets different? Titles, metadata, asset category... small tweaks can boost performance.
Funnel Conversion Rate (FCR)
This metric represents how many users went from the asset's overview page, to using the main consumption tool configured by the asset's publisher.
FCR = (Number of clicks to go to the main consumption tool) * 100 / (Number of views on the asset's overview page)
🤔 What’s FCR about?
- It shows the relevance of the asset. After reading the description, does the user actually want to use it?
- No standard benchmark here — but as a reference, average FCR for free content is between 10% and 25%.
- Again, focus on the trend over time (see KPI trends) and compare assets against each other.
- If an asset has low FCR, take a closer look: is the asset page clear? Is the info complete? Does it match what’s shown in the catalog card?
Total number of views
In the Conversion funnel section, you will find the number of impressions in the catalog, the number of asset overview page views, and the number of main and secondary consumption tool views.
Why it’s useful:
- See which assets attract attention and spot trending topics, regardless of clicks/downloads
- Just launched a new asset? You want to know if people even see it yet—before worrying about clicks or conversions.
- If a dataset has low views, maybe it’s hard to find → you may want to improve its metadata.
🔥 More improvements coming soon
- More KPIs (bounce rate, exit rate, direct traffic) will help you understand why users leave the funnel or where they come from.
- KPIs on the Asset page will show asset popularity to all users.
- Portal-level analytics will let you compare assets and spot ways to improve assets and search.