



Hello Community !
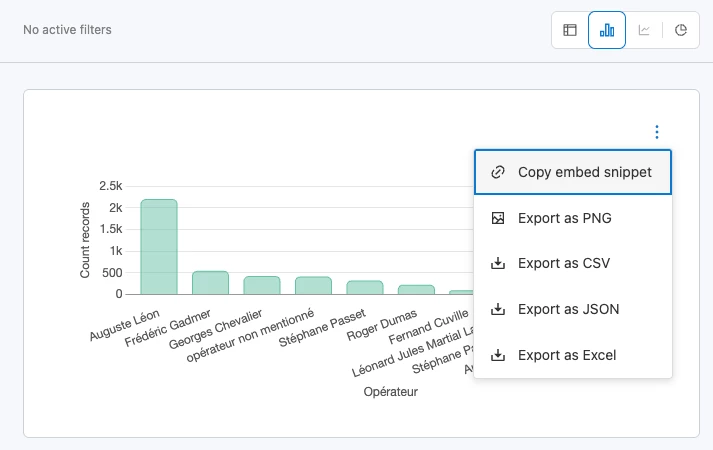
You can now embed a visualization built directly in the Explorer into an external page.
How it works
-
Open a chart or aggregated table in the Explorer
-
Click the block menu (⋮) → Copy embed snippet
-
Paste the
<iframe>wherever you need it
Key details
-
The embed displays only the visualization while preserving your current configuration and applied filters (what you see is what you share).
-
Public datasets work seamlessly without requiring authentication.
This is our first step toward making Explorer visualizations easier to share across your workflow.
Drop your thoughts, edge cases, or feature requests in the comments below, all your feedback is welcome! 👇